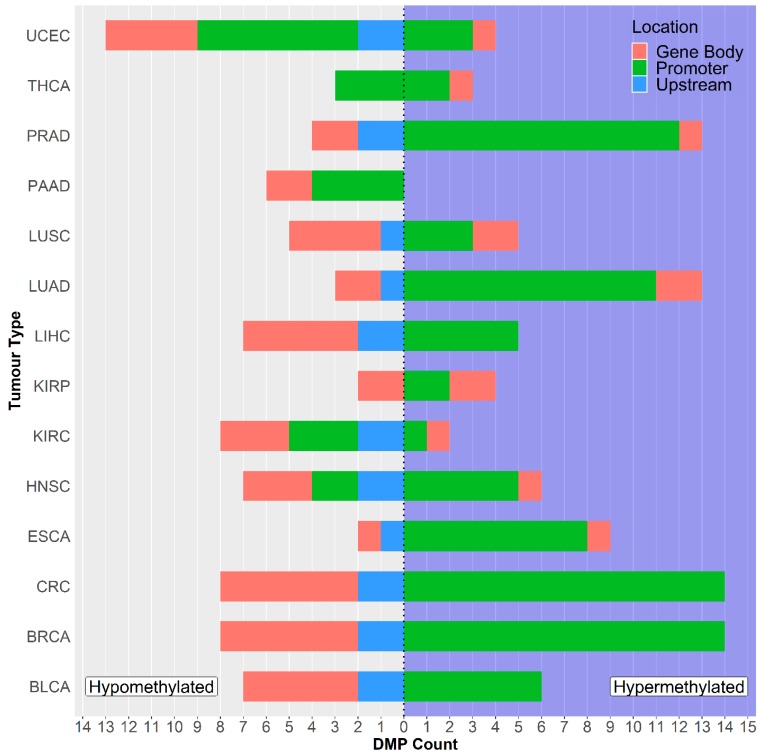
Figure 1.
Countplot showing the number of differentially methylated Gasdermin E (GSDME) probes across the datasets. The right panel corresponds to hypermethylated (DNA methylation beta values of tumor samples are significantly higher than that of normal samples) CpGs, while the left panel corresponds to hypomethylated (DNA methylation beta values of tumor are significantly lower than that of normal) CpGs. Please refer to Table 1 for tumor dataset abbreviations.

