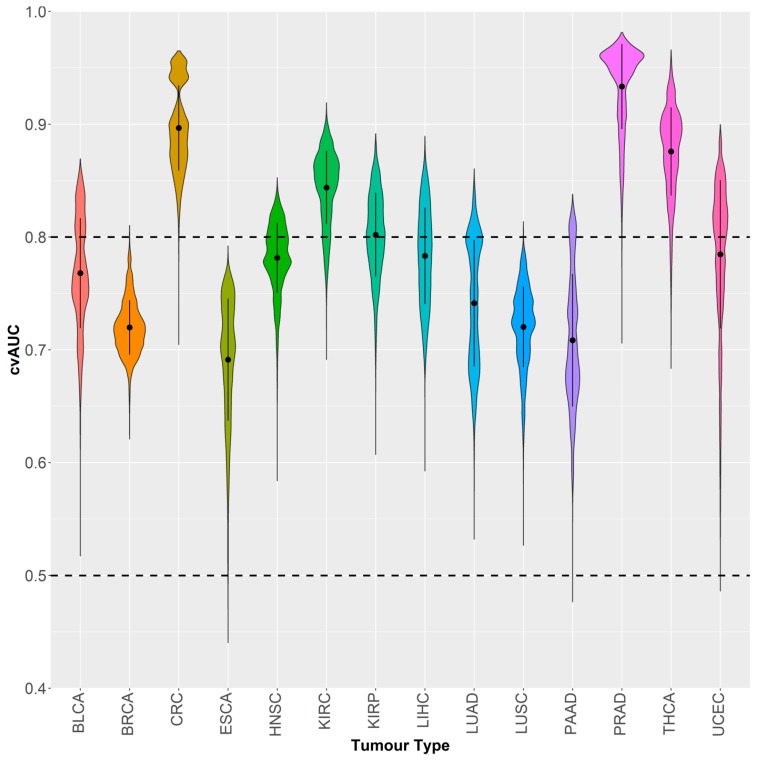
Figure 7.
Violin plot of the distribution of partial least squares-discriminant analysis (PLSDA) cross-validated AUCs of different probe combinations (74,613) classifying each of the 14 tumor types against all others. Please refer to Table 1 for tumor dataset abbreviations.

