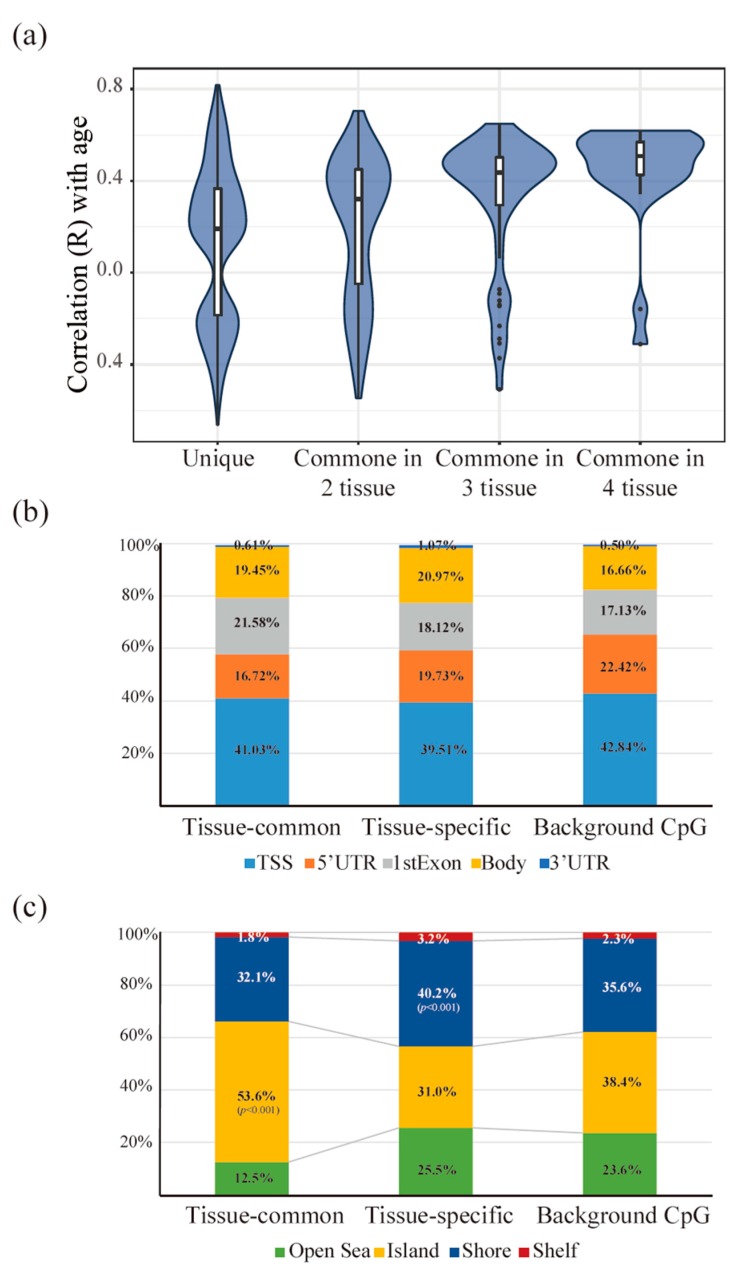
Figure 4.
Different patterns between the tissue-common and tissue-specific groups. Different characteristics of the methylation direction and location between the tissue-common and tissue-specific groups (a–c) (a) When the correlation coefficient of the beta values of each methylation site and age were compared, more positive ageCGs were found in aging-related CpG sites. However, the ratio of negative ageCGs was higher in the unique groups defined as tissue-specific. In addition, the ratio of positive ageCGs increased as the number of appearances in the tissue model increased. (b) When the methylation locations based on the gene structure were compared, no significant changes were found between the two groups (p = 0.4059). We compared the methylation location sites in the 27 K platform and found more gene body regions that contained aging-related CpG sites (p < 10−6). (c) We compared the locations of the methylation sites in the CpG islands and CpG shores and found more CpG island regions in the tissue-common group (p < 10−6) and more CpG shore regions in the tissue-specific group (p = 0.0001).

