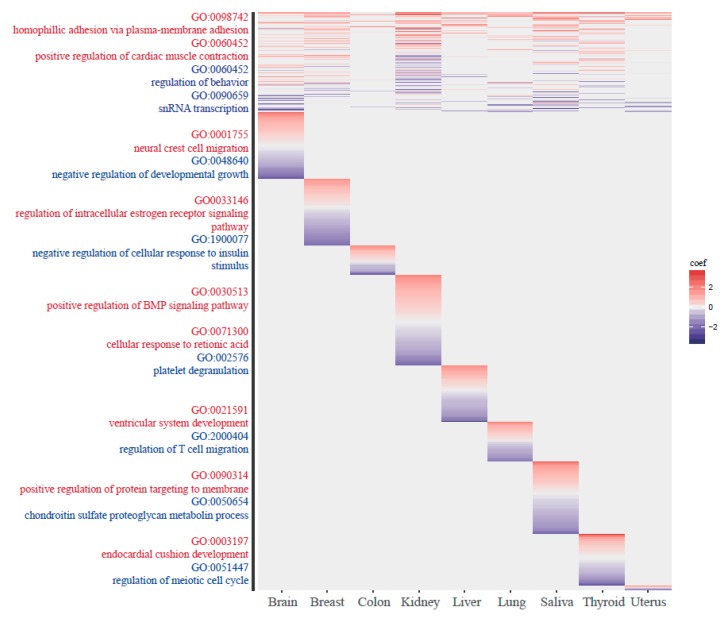
Figure 6.
Gene ontology (GO) analysis. GO terms for the closest gene of each methylation group are shown. Because we conducted the gene ontology analysis by separating the sites into positive and negative ageCGs, red color indicates the GO terms from the positive ageCGs and blue color indicates the negative ageCGs.

