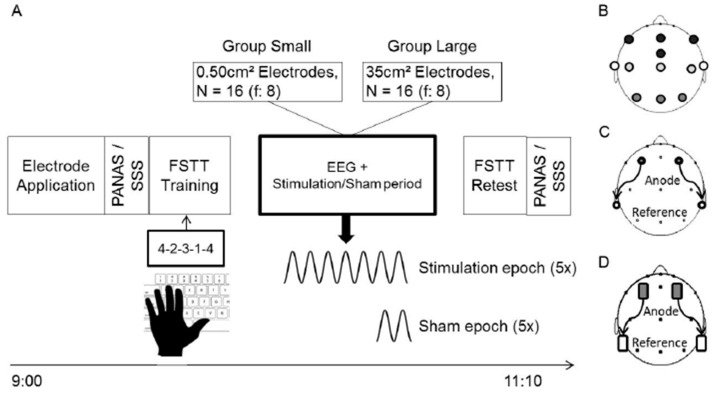
Figure 1.
A schematic view of the experimental procedure. (A) Timeline of the experimental procedure for Group Small and Group Large. (B) Locations of EEG electrodes, and stimulation electrodes for Group Small (C) and Group Large (D). Open circles and rectangles in (C,D) represent the return electrodes. PANAS, Positive and Negative Affective Scale; SSS, Stanford Sleepiness Scale; FSTT, Finger sequence tapping task.

