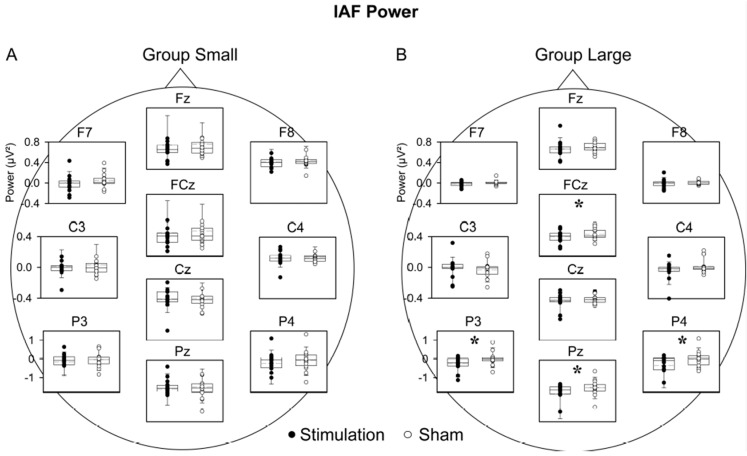
Figure 3.
Comparison of IAF power between stimulation and sham conditions for Group Small and Group Large. (A) For Group Small there were no significant differences between conditions. (B) Group Large revealed significantly lower IAF power in the stimulation than sham condition at FCz and the parietal region. For clarity temporal sites (T5, T6) are not shown. Each box plot shows the median as the horizontal line, with the bottom and top whiskers representing 10th and 90th percentiles, respectively. Circles represent the individual subject. * p < 0.05.

