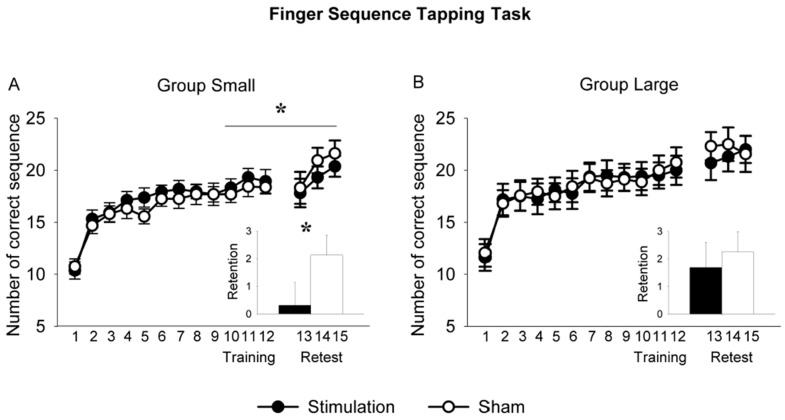
Figure 4.
Training and retest performance on the finger sequence tapping task in the conditions stimulation and sham for Group Small (A) and Group Large (B). The x-axis represents the number of correct sequences for Training (trials 1–12) and Retest (trials 13–15). In the insets “Training” refers to the average of sequences 10–12 and “Retest” to the average of sequences 13–15. In Group Small improvement on the task was significantly reduced in the stimulation condition compared to sham. This reduction was not observed in Group Large. Asterisk and vertical line represent the significant COND × TIME interaction; the asterisk in the bar chart depicts the significant difference of the paired-sample t-test. * p < 0.05.

