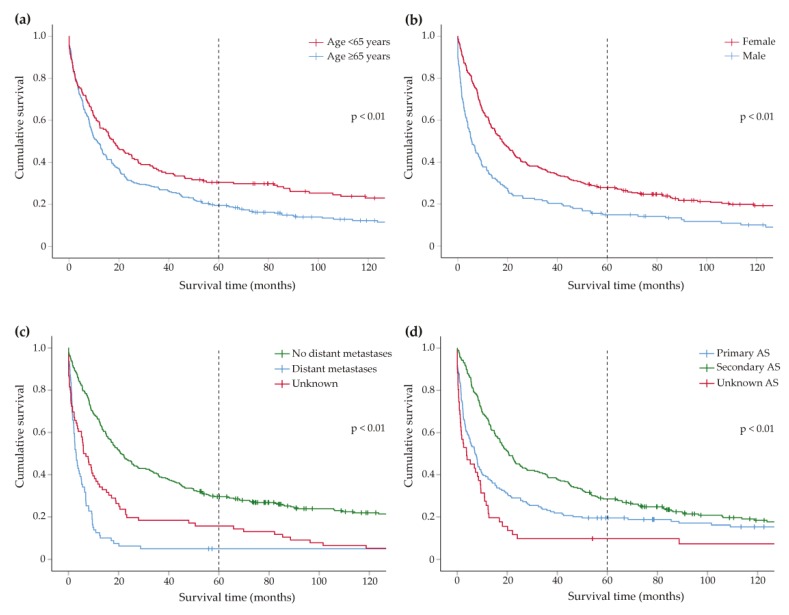
Figure 1.
Overall survival. (a) Kaplan–Meier curves showing the difference in 10-year overall survival between patients <65 years and ≥65 years, (b) Kaplan–Meier curves showing the difference in 10-year overall survival between male and female patients, (c) Kaplan–Meier curves showing the difference in 10-year overall survival between patients with and without distant metastasis, (d) Kaplan–Meier curves showing the difference in 10-year overall survival between clinical subgroups.* Dotted line represents five-year overall survival.

