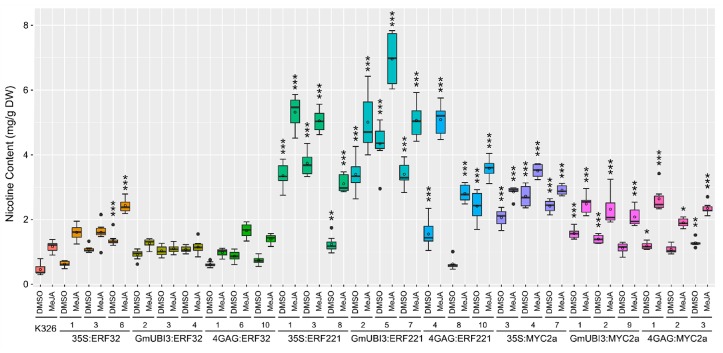
Figure 3.
Quantification of nicotine in wild-type and transgenic tobacco by gas chromatography-mass spectrometry (GC-MS). Treatment with either 0.1% DMSO (control) or 100 µM MeJA was applied to 5-week-old wild-type or transgenic plantlets for 48 h. The leaf tissue was collected for alkaloid extraction and GC-MS was performed to quantify nicotine content. For each treatment, six to eight individuals were tested independently for each sample group. The distribution of nicotine level in each group is displayed with a boxplot. The upper and lower error bars represent the maximum and minimum values, solid dots represent outliers and the solid bar inside the box represents the median. Means are indicated with circles. Statistical analysis was performed with one-way analysis of variance (ANOVA) followed by Tukey’s honest significant difference (HSD) test for multiple pairwise comparisons. * indicates the level of significance based on the adjusted p-value between the wild-type and each transgenic group under the same treatment: *** p < 0.001, ** p < 0.01, * p < 0.05.

