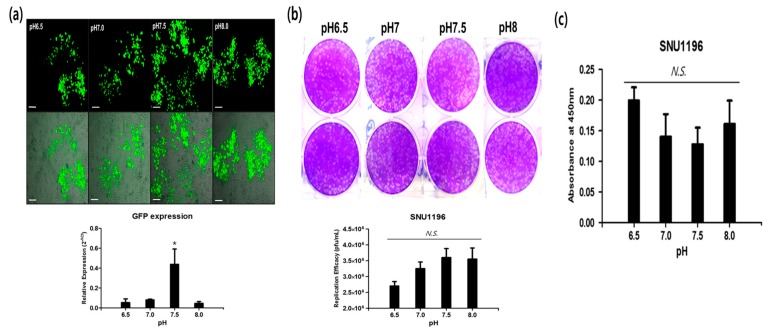
Figure 6.
CVV infectivity in CCA. (a) Green fluorescence expressions in SNU245 at different pHs (top), 48 h after CVV infection. GFP gene expression from cells cultured in different pHs of media (bottom) (scale bar 200 um); * p < 0.05, one-way ANOVA. (b) Replication efficacy in SNU1196 cultured in different pHs of media. (c) WST-1 assay results of SNU1196 cells cultured in different pHs of media. N.S., * p > 0.05, one-way ANOVA.

