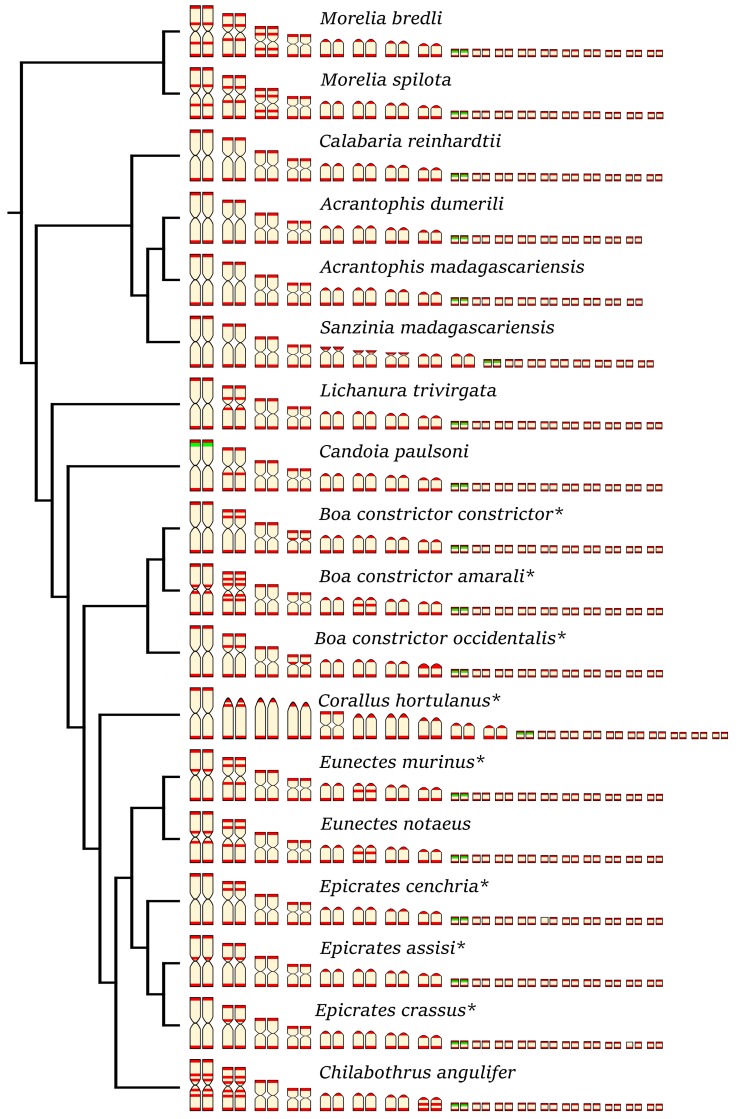
Figure 7.
Idiogram showing the comparative topology of ITRs (in red) and rDNA loci (in green) on the chromosomes of 18 species of boas and pythons. The original data were extracted from Viana et al. [17] for species marked with asterisk (*). The phylogenetic relationships follow Reynolds et al. [39].

