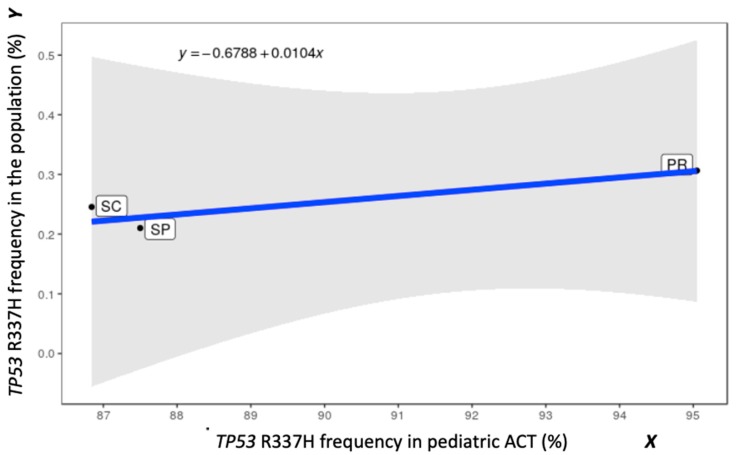
Figure 2.
The R337H frequencies (population versus ACT) and the obtained linear regression (LR) based on the overall averages for each state (SP, Paraná state (PR), and Santa Catarina (SC)). The blue straight line was obtained by simple LR using the method of least squares weighted by the number of individuals tested in each state, assuming equal weights for the considered variables. The shaded area represents the 95% confidence interval of the line assuming the normality of the errors.

