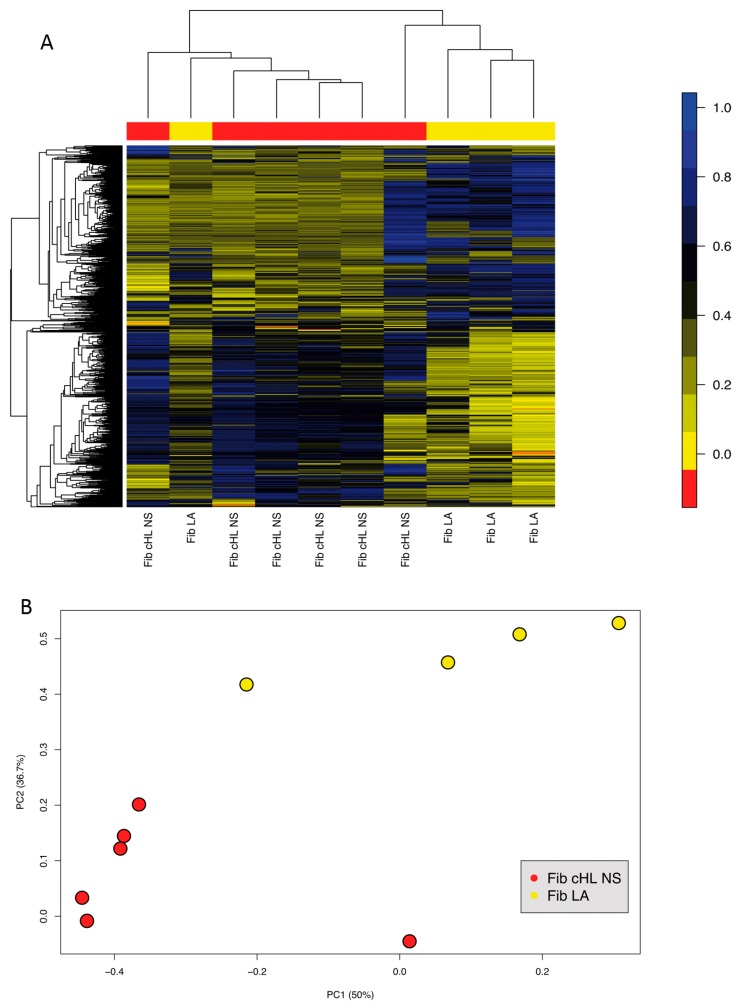
Figure 2.
Methylation profiles remain consistent in fibroblasts obtained from lymphadenitis and NS cHL. (A) Unsupervised hierarchical clustering of fibroblasts from lymphadenitis (Fib LA, n = 4, yellow) and from NS cHL (n = 6, red) considering all tags (848) with a differential methylation and standard deviation >0.25. (B) Principal component analysis of methylation patterns in fibroblasts from lymphadenitis (Fib LA, n = 4, yellow) and NS cHL (n = 6, red) considering all tags with a differential methylation and standard deviation >0.25.

