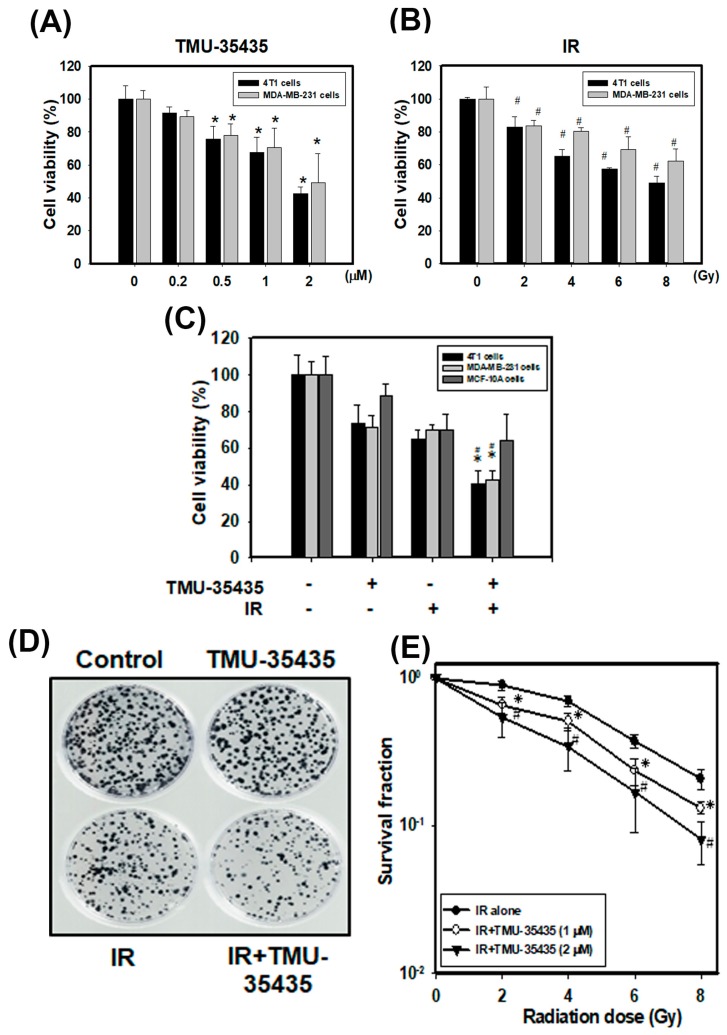
Figure 1.
Cytotoxic effects of TMU-35435 and IR in MDA-MB-231 and 4T1 cells. (A) The cell viability at different concentrations. The cells were incubated with 0.2, 0.5, 1, or 2 μM TMU-35435 for 24 h. * p < 0.05, TMU-35435 versus control. (B) The cell viability at different doses. The cells were treated with 2, 4, 6, or 8 Gy of IR for 24 h. # p < 0.05, IR versus control. (C) Cell viability effects of TMU-35435 (1 μM) and IR (4 Gy) for 24 h. * p < 0.05, TMU-35435 versus combination treatment. # p < 0.05, IR versus combination treatment. (D) Clonogenic assays in 4T1 cells treated with IR (4 Gy) and/or TMU-35435 (1 μM). Colonies (containing ≥50 cells) were stained with crystal violet solution. (E) IR dose–response survival curves of 4T1 cells with or without TMU-35435. * p < 0.05, IR alone versus IR + TMU-35435 (1 μM). # p < 0.05, IR alone versus IR alone versus IR + TMU-35435 (2 μM).

