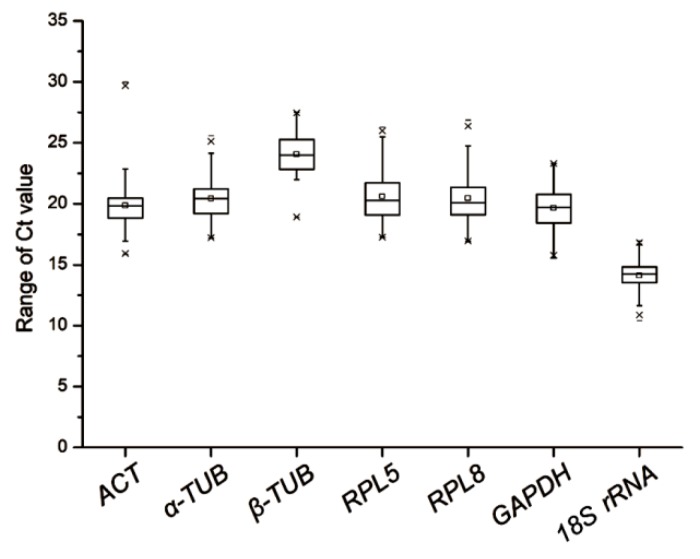
Figure 1.
Ranges of expression of the seven selected reference genes in all analyzed samples. The whisker box plots represent the cycle threshold numbers (Ct value) of the seven reference genes. The horizontal lines inside the boxes are the median values, and the whiskers of the boxes are the minimum and maximum Ct values.

