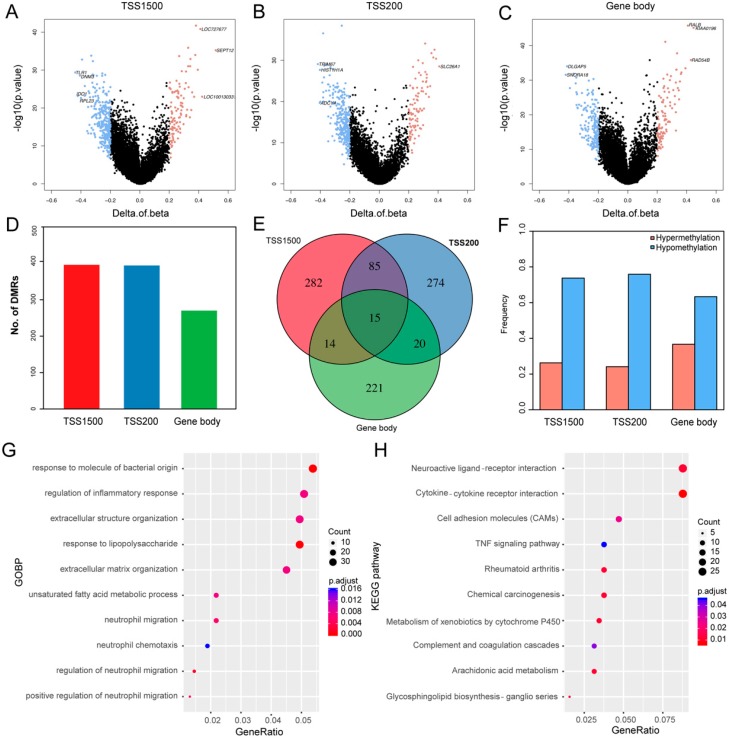
Figure 1.
Differentially methylated genes (DMGs) in triple-negative breast cancer (TNBC). (A–C) Volcano plots showing the distributions of DMGs in TSS1500, TSS200, and gene body regions. The red and blue dots represent the significantly hyper- and hypomethylated DMGs. (D) Bar plot showing the numbers of DMGs in TSS1500 (n = 396), TSS200 (n = 394), and gene body (n = 270) regions. (E) Venn plot showing the intersections of DMGs between the three regions. Only 15 genes were differentially methylated in all three regions, although there were numerous region-specific DMGs in TSS1500 (n = 282), TSS200 (n = 274), and gene body (n = 221). (F) Bar plots showing the proportions of methylation in the three regions. (G) The top 10 Gene Ontology Biological Process (GOBP) terms in the three regions. (H) The top 10 Kyoto Encyclopedia of Genes and Genomes (KEGG) pathways in the three regions.

