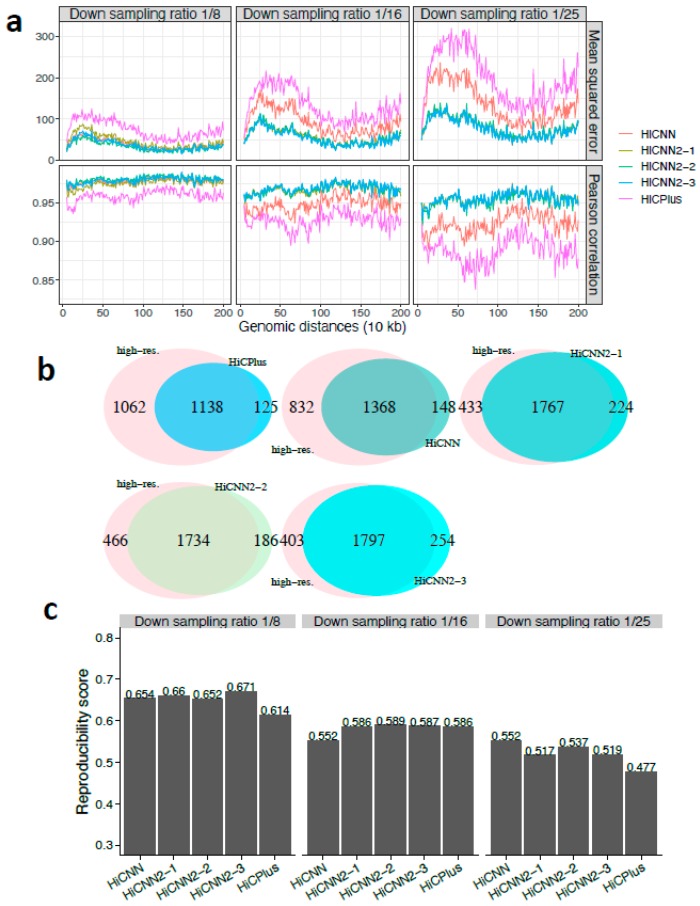
Figure 5.
The evaluation results on the bacterial C. crescentus chromosome between experimental high-resolution Hi-C (10 kb resolution) and each of the five predicted Hi-C data sets, namely, HiCPlus-enhanced, HiCNN-enhanced, HiCNN2-1-enhanced, HiCNN2-2-enhanced, and HiCNN2-3-enhanced: (a) mean squared error and Pearson’s correlations with three different down-sampling ratios (1/8, 1/16, and 1/25); (b) the effectiveness of recovering significant interactions (detected by Fit-Hi-C with q-value < 0.05) with a down-sampling ratio of 1/25; and (c) the reproducibility scores with the three down-sampling ratios.

