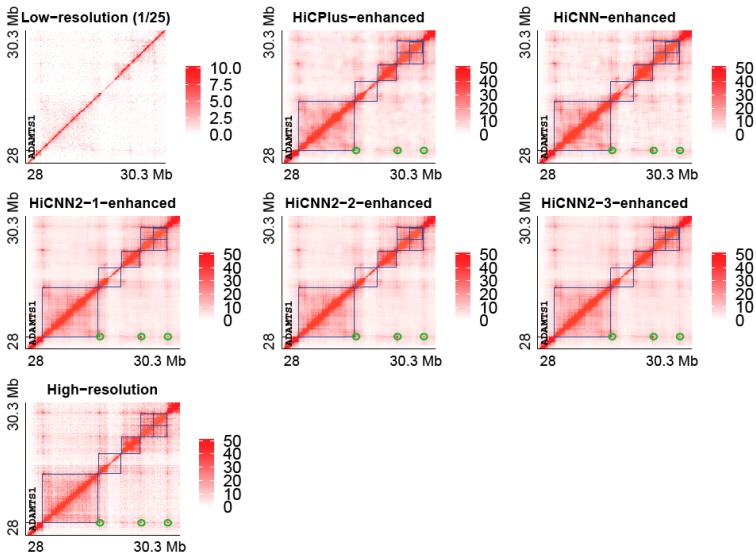
Figure 7.
The heat maps of Hi-C contact matrices from low resolution (down sampling ratio 1/25), HiCPlus-enhanced, HiCNN-enhanced, HiCNN2-1-enhanced, HiCNN2-2-enhanced, and HiCNN2-3-enhanced, and real high-resolution Hi-C data on chromosome 21 (28–30.3 Mb) of human IMR90 cells. Six topologically associating domains (blue squares) and three Hi-C peaks (green circles) are highlighted in each of the predicted and real high-resolution heat maps (blue color). The models of the five methods were trained with input from GM12878 and with a down-sampling ratio equal to 1/25.

