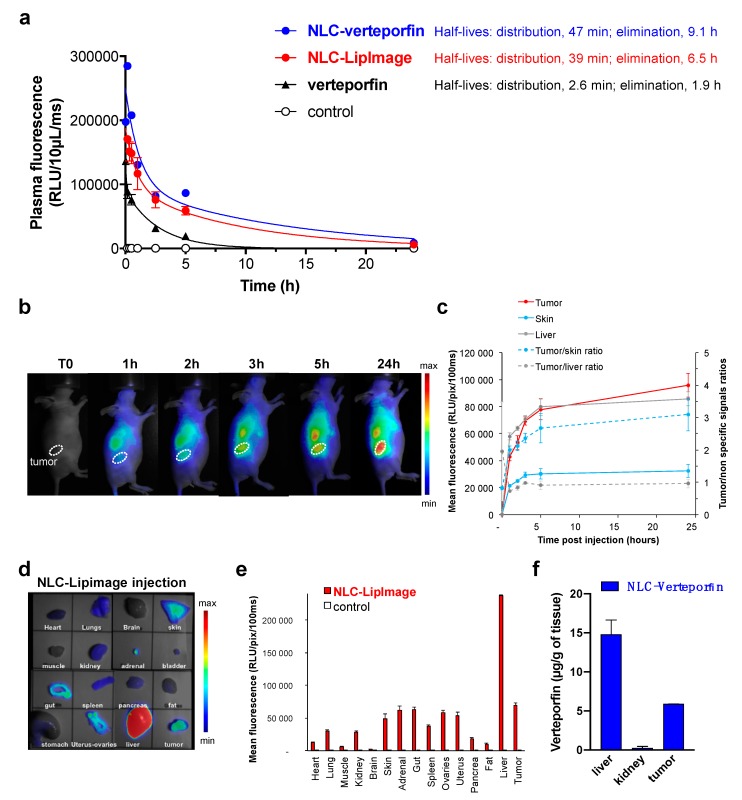
Figure 4.
NLC circulated in the bloodstream and accumulated in subcutaneous SKOV3 tumors. (a) Healthy mice were injected intravenously with NLC-verteporfin (8 mg·kg−1 of verteporfin), dye-loaded NLC (LipImageTM-815), or free verteporfin (2 mg·kg−1). Fluorescence intensity measurements of verteporfin (for free verteporfin or NLC-verteporfin), or of LipImageTM-815 (for NLC-LipImage) were performed on blood plasma samples taken at different time points. The results are expressed as the mean ± SD (n = 3). (b–e) Mice with SKOV3 subcutaneous tumors were injected intravenously with NLC-LipImage. (b) Representative fluorescence images (50 ms integration time) recorded using 2D-Fluorescence reflectance optical imaging (FRI) at different times after intravenous injection are shown (min-max: 4243-55869). Dotted lines show subcutaneous tumors. (c) Regions of interest (ROI) are defined on tumor, liver, and skin to semi-quantify the amount of photons detected per pixel. The results are expressed as the mean fluorescence ± SD in tumor, skin, and liver, and as the mean tumor/skin and tumor/liver fluorescence ratios ± SD (n = 3). (d) Fluorescence images were performed on isolated organs 24 h after intravenous injection of NLC-LipImage. Representative fluorescence images of organs in injected and non-injected mice are shown (20 ms integration time; min-max: 1414-27109). (e) ROI are defined on the extracted organs to semi-quantify the amount of photons detected per pixel. The results are expressed as the mean ± SD in SKOV3 tumor-bearing mice (n = 3) and non-injected mice (control). (f) Mice with SKOV3 subcutaneous tumors were injected intravenously with NLC-verteporfin (8 mg·kg−1 of verteporfin). Verteporfin measurements were performed by HPLC at 24 h on tumors, livers, and kidneys. The results are expressed as the mean ± SD (n = 2).

