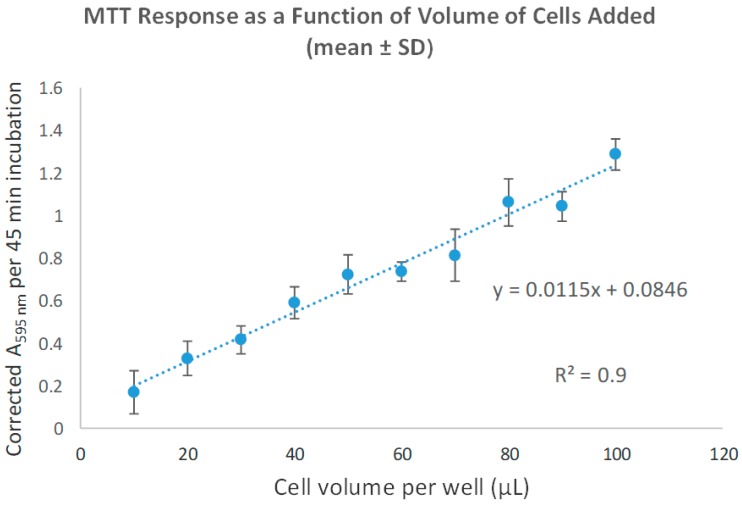
Figure 1.
Results (mean ± SD; n = 4) from the serial dilution of a glial cell pool representative experiment. Data are shown by plotting the corrected A595nm per 45 min value as a function of volume of cell pool added to the well (with the volume of complete DMEM also added to yield a final volume of 100 µL; for example, if 20 µL of cell pool was seeded then 80 µL of medium was also added).

