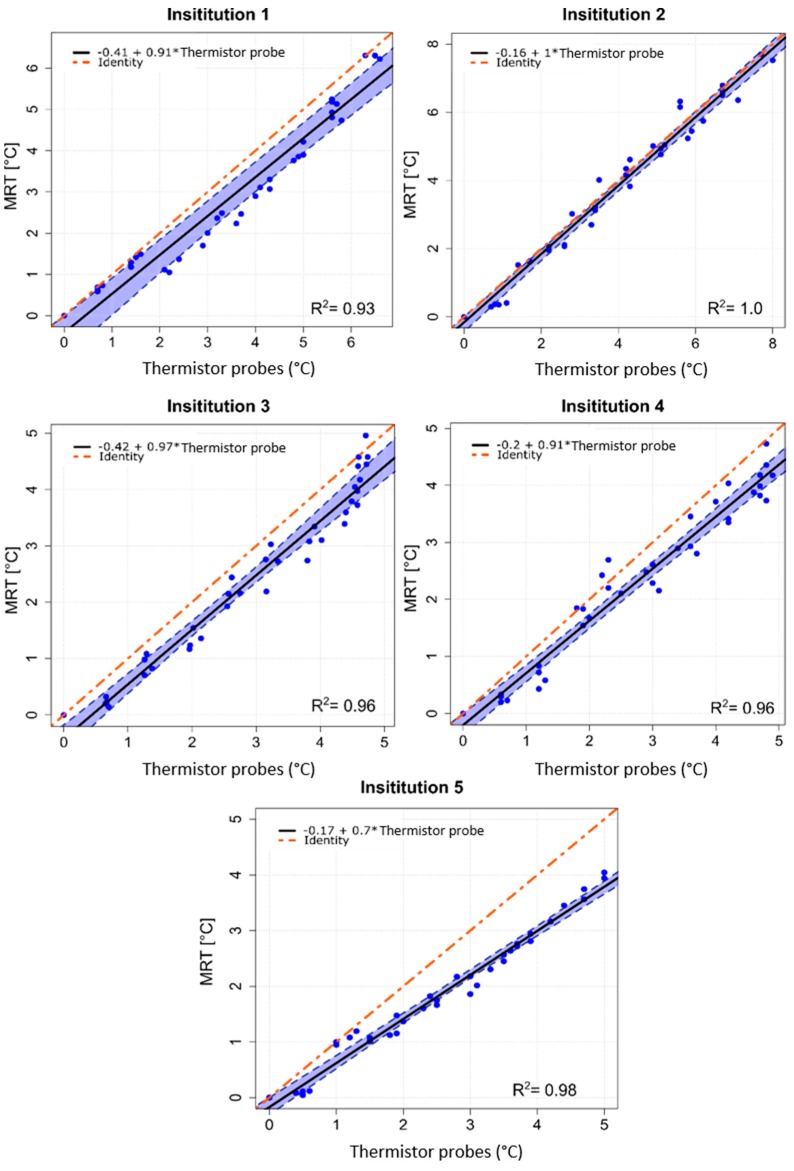
Figure 3.
Scatter plots of MRT data as a function of high resistance thermistor probes measurements for centric heating target, measurements performed at the five institutions. The estimated linear regression equation (solid black line), the 95% confidence interval upper and lower limits (dashed blue lines) and the identity line of both methods (dot-dashed red line) are shown for all institutions. R2 coefficients are reported.

