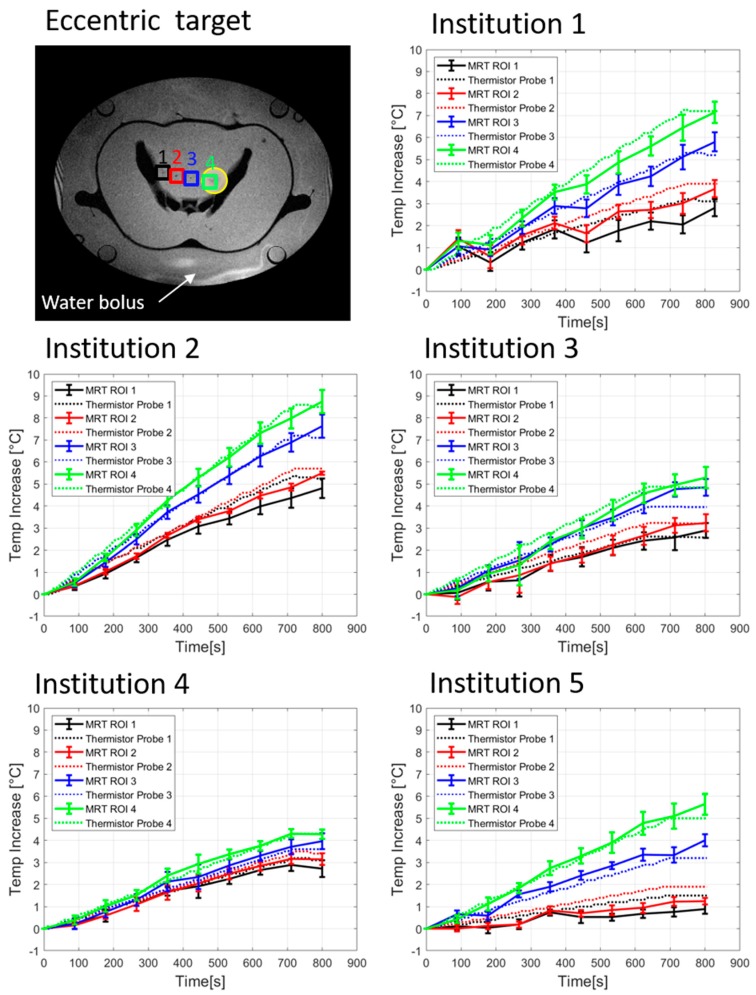
Figure 5.
Temporal evolution of temperature increase determined by high resistance thermistor probes and by computed MRT for eccentric heating target (yellow circle). The position of probes and ROIs in the phantom are indicated by numbers and coloured squares in the MR image showing the cross-section of the phantom and the surrounding water bolus. Measurements were performed at five different institutions.

