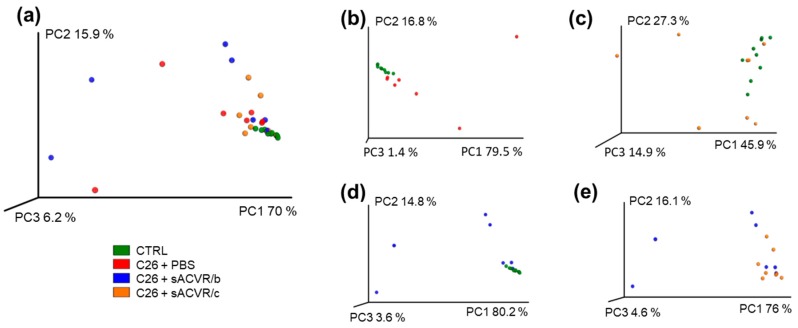
Figure 2.
Beta-diversity of the mice microbiota samples. No clear differences were visually observed between the groups in principal component analysis (PCA) plot. (a) PCA plot of all groups; (b) PCA plot of groups CTRL and C26 + PBS; (c) PCA plot of groups CTRL and C26 + sACVR/c; (d) PCA plot of groups CTRL and C26 + sACVR/b; (e) PCA plot of groups C26 + sACVR/b and C26 + sACVR/c. Control (CTRL, n = 9), cancer (C26 + PBS, n = 7), the group that received sACVR2B until tumor formation (C26 + sACVR/b, n = 7), and the group that received sACVR2B until death (C26 + sACVR/c, n = 8).

