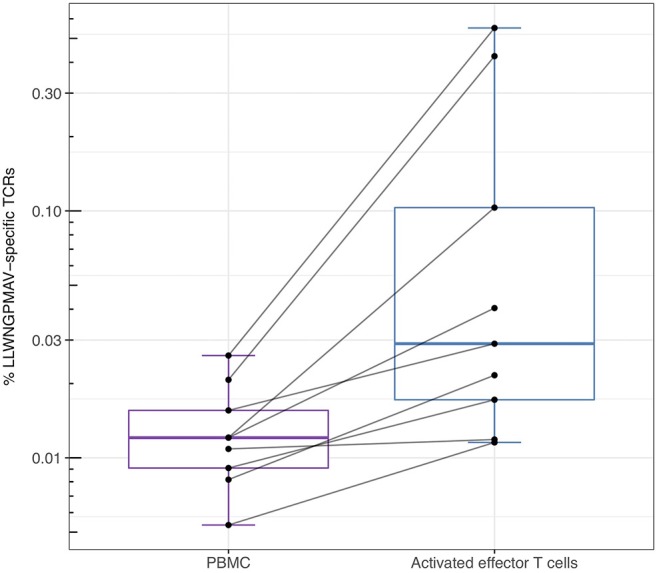
Figure 4.

Percentage of unique identified LLWNGPMAV-specific TCRs in the post-vaccination repertoires from Dewitt et al. (1). The box plots show the log-scaled proportion of unique LLWNGPMAV-specific T cells in post-vaccination PBMC samples and activated TCR repertoires [i.e., “CD3+ CD8+CD14−CD19−CD38+HLA-DR+ Ag-experienced, activated effector T cells” (1)] for the nine volunteers from Dewitt et al. (1). Epitope-specific TCRs were identified with TCRex using a 0.01% BPR threshold. An increase in the number of unique LLWNGPMAV-specific cells was found in the activated dataset.
