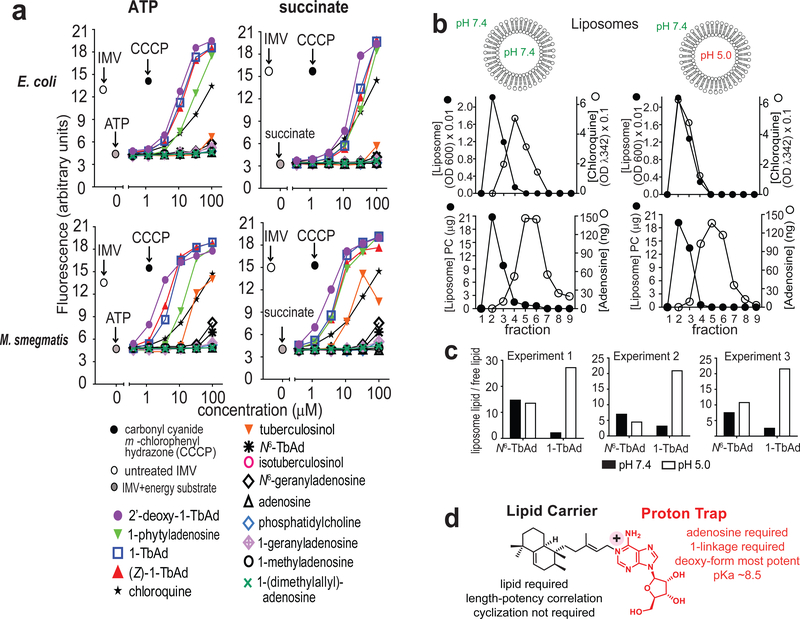
Figure 5. Transmembrane permeation by TbAd analogs.
a) Fluorescence spectroscopy assays of E. coli and M. smegmatis (M. smeg) inverted membrane vesicles (IMVs) used ATP or succinate to generate a pH gradient, followed by addition of the indicated compound. Four representative assays are shown from a total of 6 assays that found similar results and which were conducted in a blinded fashion. b-c) Liposomes with a neutral or acidic interior were treated with negative control compounds (adenosine, N6-TbAd), a positive control (chloroquine), or 1-TbAd, then subjected to size exclusion chromatography. Liposomes (black) were measured using absorbance at 600 nm, and chloroquine was measured at 342 nm. Adenosine-containing compounds were measured using MS. 1-TbAd at pH 5.0 differed significantly from all other treatments (p < 0.01) by least-squares means post test with adjustment by Tukey’s method after fitting a linear model and factorial ANOVA. d) Summary of cellular, IMV and liposome-based analysis of TbAd analogs identifies separate roles on the lipid carrier and proton trap site at the 1-position of adenosine.

