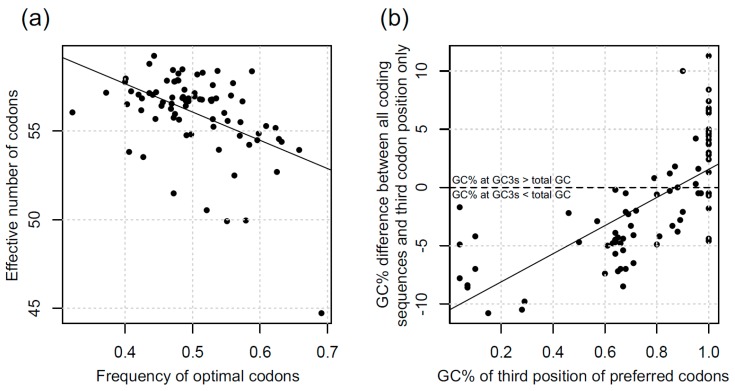
Figure 1.
(a) Correlation between effective number of codons and frequency of optimal codons considering all genes in each species. Pearson’s correlation: rho = −0.475, P value = 6E-6; and (b) Correlation between the GC% of the optimal codons’ third position and the difference of GC% between all the coding genome and GC3s only. Pearson’s correlation: rho = 0.695, P value = 3E-13.

