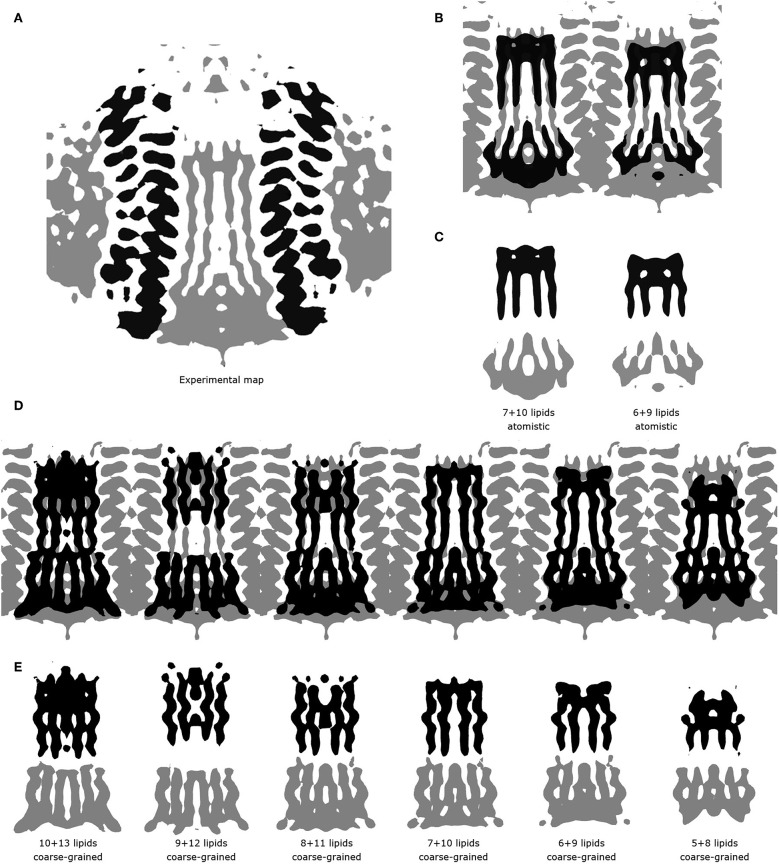
Figure 3.
Comparison of experimental and simulated lipid densities. In all panels, the protein positions are aligned. Experimental map is shown at the level of 0.2 a.u., CG and atomistic simulated maps are shown at the level of 1.3 and 7 a.u., respectively. (A) 14-fold averaged Cryo-EM map. Densities corresponding to subunits c are shown in black, other densities are shown in gray. (B) Comparison of the results of atomistic simulations with the experimental map. Experimental map is shown in gray, simulated densities are shown in black. (C) Densities corresponding to lipids at the loop side (black) and to lipids at the NC-side (gray). (D) Comparison of the results of coarse grained simulations with the experimental map. Experimental map is shown in gray, simulated densities are shown in black. (E) Densities corresponding to lipids at the loop side (black) and to lipids at the NC-side (gray).

