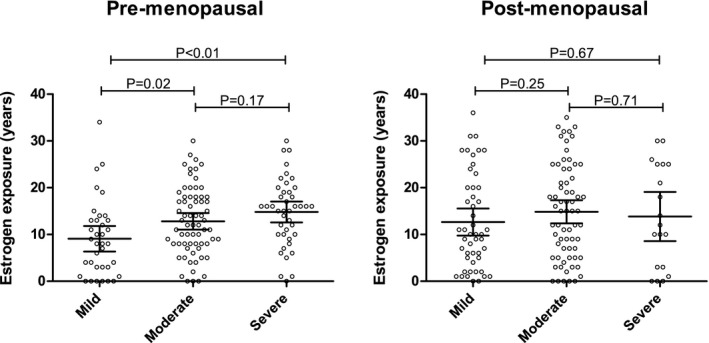
Figure 2.

Categorical analysis. Categorical analysis for premenopausal (a) and postmenopausal subgroups (b). Estrogen‐containing oral contraceptives use (years) on the y‐axis and disease severity: mild (height‐adjusted total liver volume (hTLV) < 1,600 mL/m), moderate (hTLV 1,600–3,200 mL/m), and severe (>3,200 mL/m) on the x‐axis. All data points represent individual patients. Mean and 95% confidence interval are superimposed.
