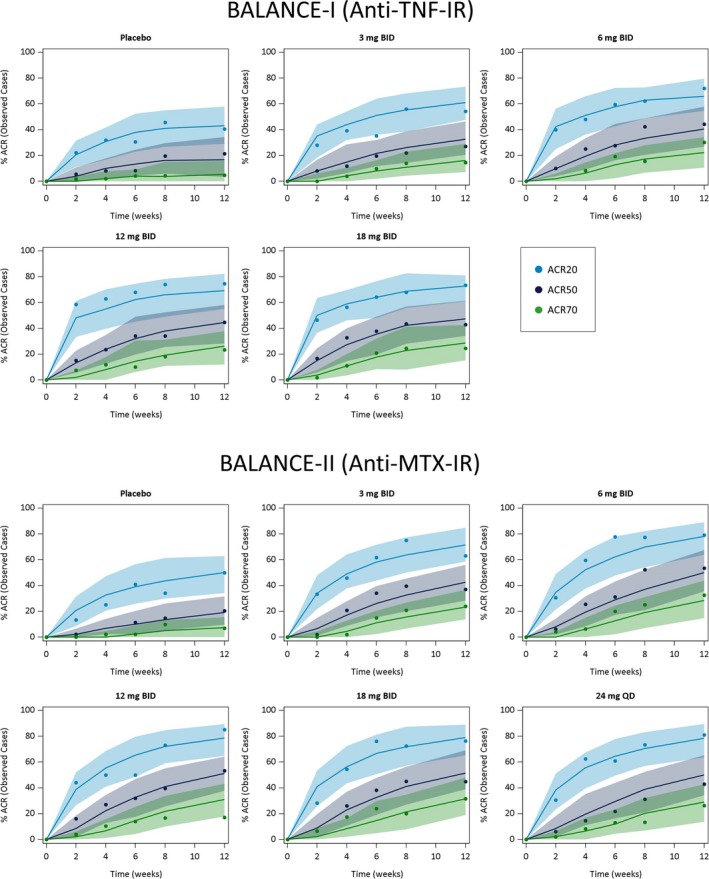
Figure 2.

Observed and model‐predicted American College of Rheumatology 20%/50%/70% improvement criteria (ACR20/50/70) responses (observed cases) vs. time stratified by dose and patient population. Symbols represent the observed time course of the percentage of patients achieving ACR20, (blue) ACR50, (black) and ACR70 (green) responses. Solid lines and shaded areas represent the exposure–response model‐predicted median and 90% prediction intervals, respectively. IR, inadequate responder; MTX, methotrexate.
