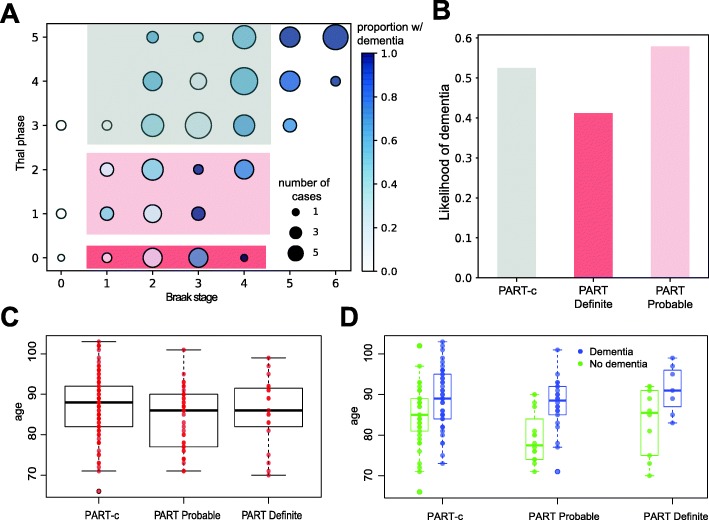
Fig. 5.
a Schematic showing NFT vs Aβ progression, with a main sequence of cases showing co-progression of the two AD neuropathologies. Cases can be defined showing NFT (Braak I-V) but no Aβ pathology corresponding to PART-d (red box), or with low levels of Aβ corresponding to PART-p (pink box). A comparison group, designated PART-c with similar Braak stage but more Aβ (Braak I-IV/Thal 3.-5) can be defined as those with more expected levels of Aβ for typical AD neuropathological progression (blue box). b likelihood of dementia for PART definite and probable cases and for the comparison PART-c group. c Overall age distribution of PART groups. d Age distribution according to dementia status for each of the PART groups

