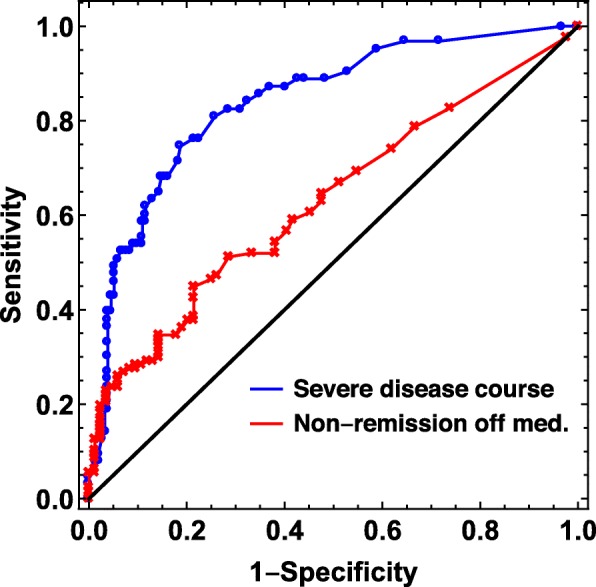
Fig. 1.

Receiver operating characteristic (ROC) curves showing external validation of the Canadian prediction model in the Nordic JIA cohort. Blue curve: using severe disease course as outcome. C-index with IQR = 0.85 (0.83–0.87). Red curve: using non-achievement of remission as outcome. C-index with IQR = 0.66 (0.63–0.68)
