Figure 1.
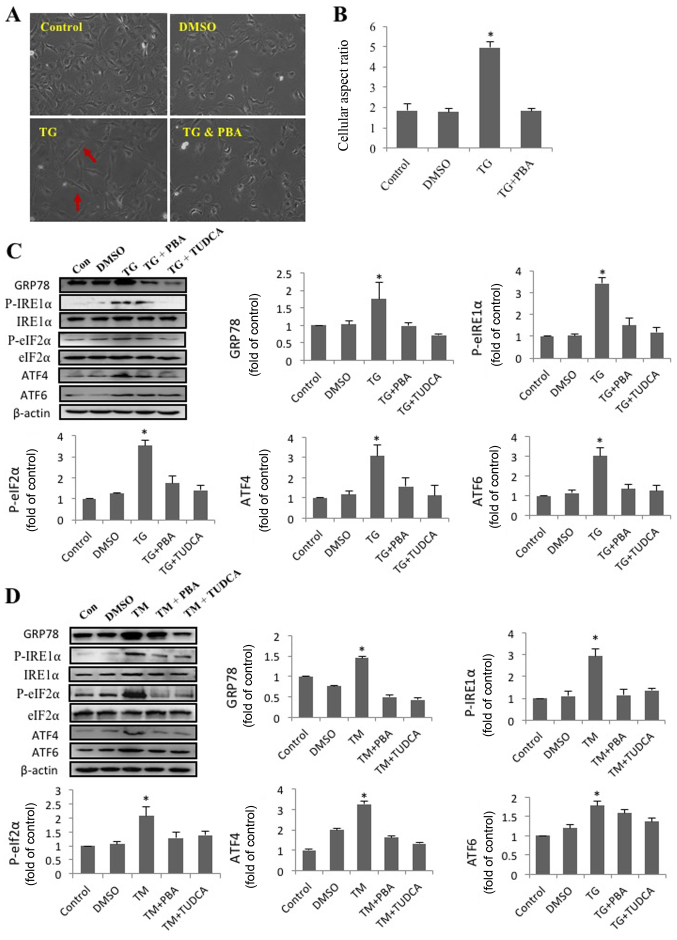
SRA01/04 cells treated with endoplasmic reticulum stress inducers exhibit a morphological change, from an epithelial- to a fibroblast-like morphology. SRA01/04 cells were treated with 0.01 µM TG or a combination of 0.01 µM TG and 0.25 mM PBA for 24 h. Untreated SRA01/04 cells served as the control group. (A) Micrographs were obtained under an inverted phase-contrast microscope (magnification, ×20). The red arrows indicate that TG-treated cells had a spindle-like appearance and an elongated long axis. (B) The cellular aspect ratio was analyzed with ImageJ software (n=3). *P<0.05 vs. control. SRA01/04 cells were treated with 0.01 µM TG, 0.01 µM TG and 0.25 mM PBA, 0.01 µM TG and 2 mM TUDCA, 0.1 µM TM, 0.1 µM TM and 0.25 mM PBA or 0.1 µM TM and 2 mM TUDCA for 24 h. (C) ER stress markers were determined by western blot analysis. (D) The expression levels of GRP78, p-IRE1α, p-eIF2α, ATF4 and ATF6 were quantified by densitometry (n=3). *P<0.05 vs. control. TG, thapsigargin; TM, tunicamycin; PBA, 4-phenylbutyric acid; TUDCA, tauroursodeoxycholate; GRP78, glucose-regulated protein 78 kDa; P-IRE1α, phosphorylated inositol-requiring protein 1α; P-eIf2α, phosphorylated eukaryotic initiation factor 2α; ATF6, activating transcription factor 6; ATF4, activating transcription factor 4; DMSO, dimethyl sulfoxide; Con, control.

