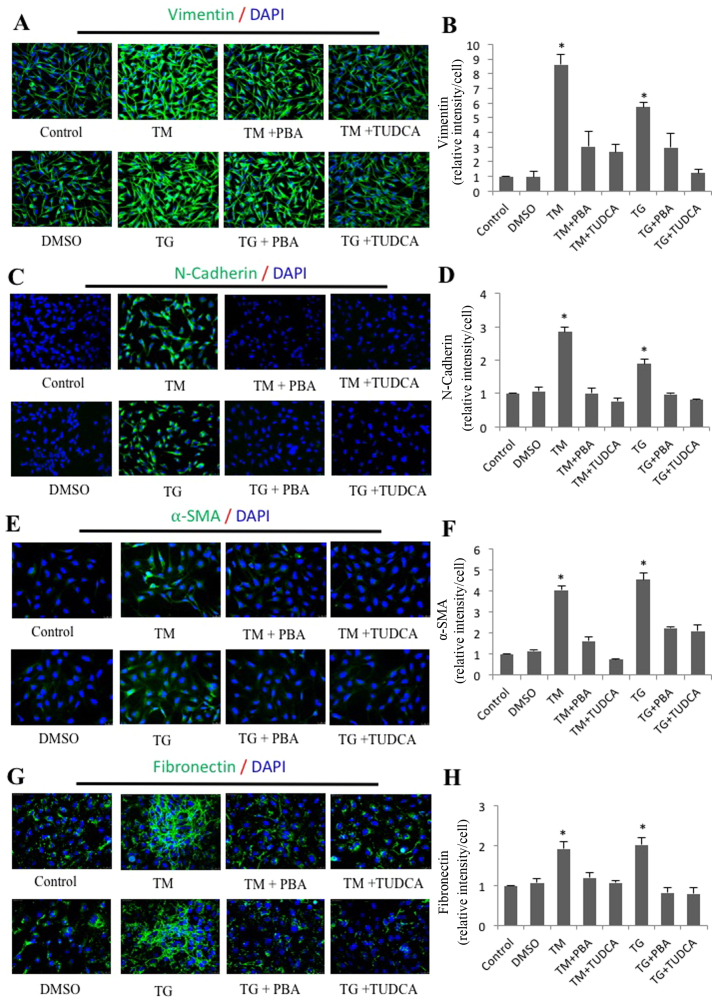
Figure 3.
Immunofluorescence analysis of endoplasmic reticulum stress-induced expression of vimentin, N-cadherin, α-SMA and fibronectin in SRA01/04 cells. SRA01/04 cells were treated with 0.01 µM TG, 0.01 µM TG and 0.25 mM PBA, 0.01 µM TG and 2 mM TUDCA, 0.1 µM TM, 0.1 µM TM and 0.25 mM PBA or 0.1 µM TM and 2 mM TUDCA for 24 h. The expression of (B) vimentin, (D) N-cadherin, (F) α-SMA and (H) fibronectin was determined by immunofluorescence analysis. The average fluorescence of (A) vimentin, (C) N-cadherin, (E) α-SMA and (G) fibronectin was quantified (n=3). *P<0.05 vs. control, magnification, ×20. α-SMA, α-smooth muscle actin; N-cadherin, neural cadherin; E-cadherin; epithelial cadherin; TG, thapsigargin; TM, tunicamycin; PBA, 4-phenylbutyric acid; TUDCA, tauroursodeoxycholate.

