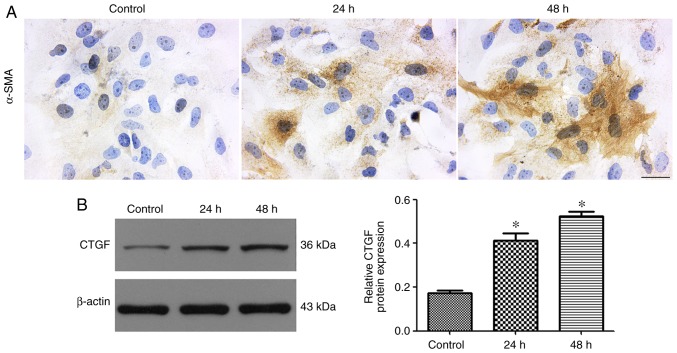
Figure 6.
Effect of TGF-β1 on the activation of LX-2 cells. (A) Representative immunocytochemistry of α-SMA in LX-2 cells before or after treatment. The brown color indicates α-SMA staining (original magnification, ×400). The scale bar represents 50 µm. (B) Western blotting showed that the expression of CTGF protein was significantly increased in activated cells, compared with that in quiescent LX-2 cells. *P<0.05 vs. TGF-β1-non-treated cells. CTGF; connective tissue growth factor; TGF-β1, transforming growth factor-β1; α-SMA, α-smooth muscle actin.

