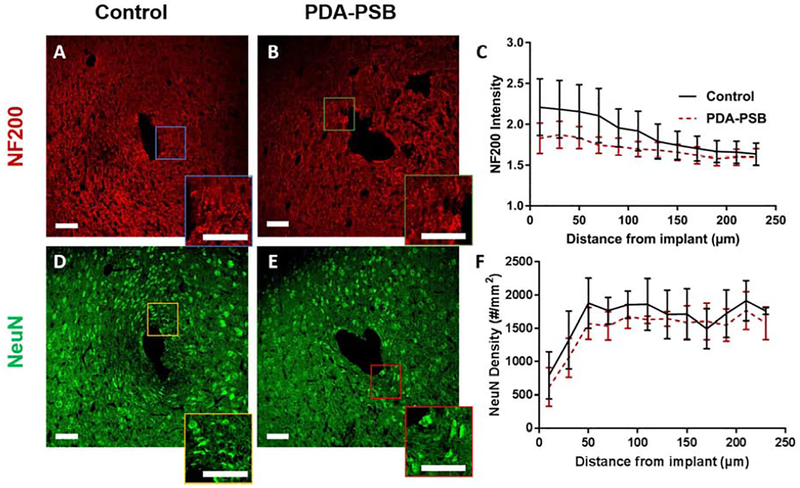
Figure 3.
Representative immunofluorescence images of NF200 (red, neurofilament; A and B) and NeuN (green, neuronal cell, D and E) around single shank electrode in control (A and D) and PDA-PSB (B and E) groups. Inset showing higher magnification images. All scale bars are 100 μm. (C) is the normalized intensity values for NF200 expression (histological samples, for control N=4. animal, N=8 sample; PDAPSB N=4 animal, N=8 sample). (F) Cell density counts per mm2 of neuronal cells at 1 week post-implant are presented (histological samples, for control N=4. animal, N=5 sample; PDA-PSB N=4 animal, N=9 sample). Results were binned 10 μm from the electrode-tissue interface until 240 μm away, with 20 μm bin size. Data showed as mean ±SE. * indicates p<0.05.

