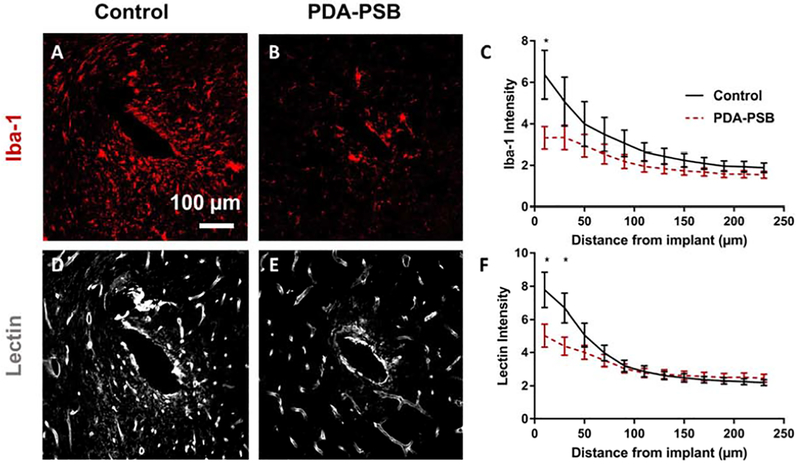
Figure 4.
Representative image of Iba-1 and Lectin staining for reactive microglia and vascular endothelium 1 week post-implantation in uncoated (A and D) and PDA-PSB coated (B and E) probes. Scale bar=100 μm. (C and F) are the normalized intensity value for Iba-1 expression (histological samples, for control N=4. animal, N=8 sample; PDA-PSB N=4 animal, N=8 sample), and lectin (histological samples, for control N=4 animal, N=18 sample; PDA-PSB N=4 animal, N=18 sample) as a function of distance from implant 1 week after implantation. Intensities were calculated 10 μm from the implant site until 240 μm away, with 20 μm bin size. Data presented as mean ±SE; * indicates p<0.05.

