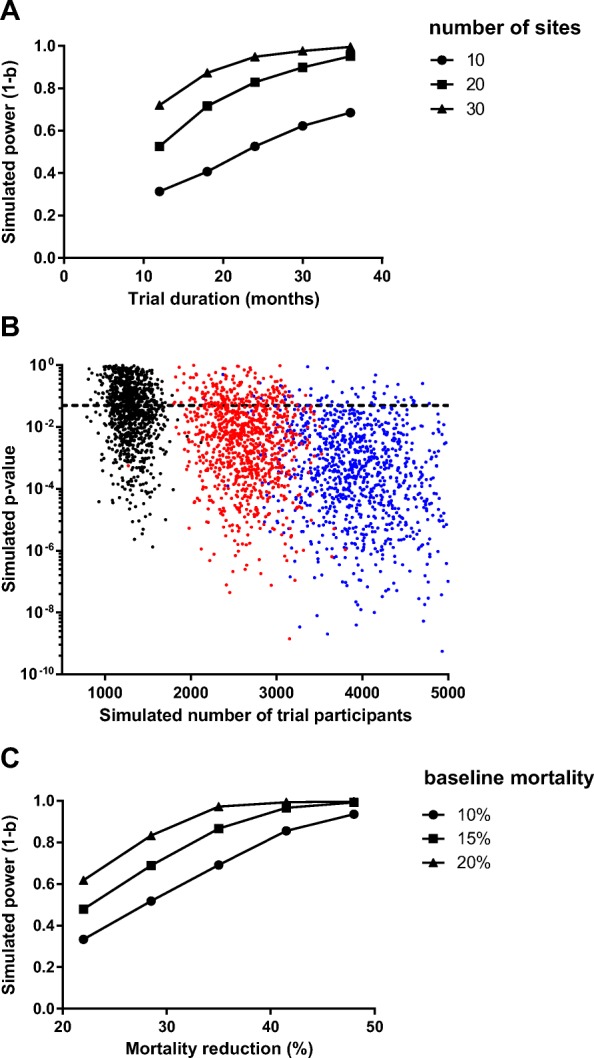
Fig. 4.

Computer simulation for sample size estimation. a In the simulation, study power varied with the number of clusters and the duration of enrolment, as expected. Approximately 20 sites enrolling patients over 24 months would provide power of 80%. Each dot represents at least 100 simulated trials. b Each dot represents one simulated trial with 20 sites and 20 steps, enrolling patients for two weeks (black dots), four weeks (red dots), or six weeks (blue dots) at each step. The study power is approximated by the proportion of trials appropriately detecting a statistically significant effect of SPO2 (p < 0.05, dotted line). The simulation was repeated 3000 times to generate a plot of p value and number of trial participants. For trial simulations with four-week steps (total duration 21 months), the median number of participants enrolled was 2600 (interquartile range 2400–2900) and the statistical power was 82%. c In the simulation, study power was also sensitive to variations in the assumptions of baseline mortality and mortality reduction. Our base case (15% baseline mortality, mortality reduction of 35%) was associated with statistical power of 80%. Each dot represents at least 100 simulated trials
