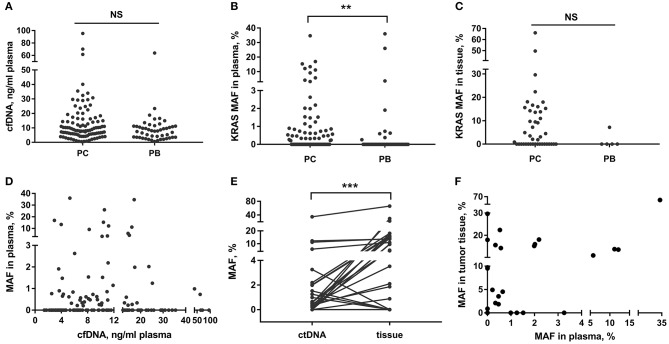
Figure 1.
cfDNA content and KRAS mutation in PC and PB patients. (A–C) Detection of total cfDNA amount and KRAS MAF in ctDNA and tissue in PC and PB diseases. (D) Correlation between KRAS MAF in ctDNA and cfDNA concentration. (E,F) Comparison of KRAS MAF in ctDNA and matched tissue. **p < 0.01; ***p < 0.001; NS, not significant.

