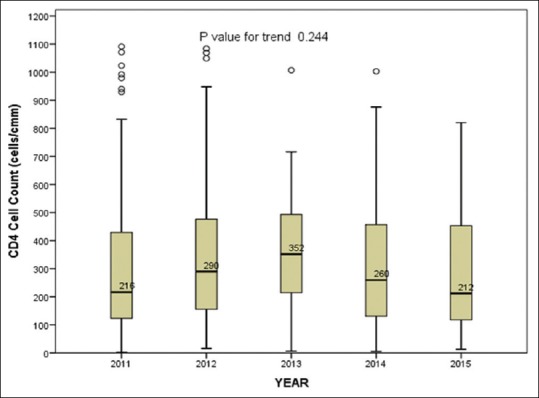
Figure 2.

Trends in the median CD4 cell counts over time. The ends of the box are the upper and lower quartiles, and the median is marked by a horizontal line inside the box. The median CD4 count and number of HIV-1-positive cases per year are given in the table
