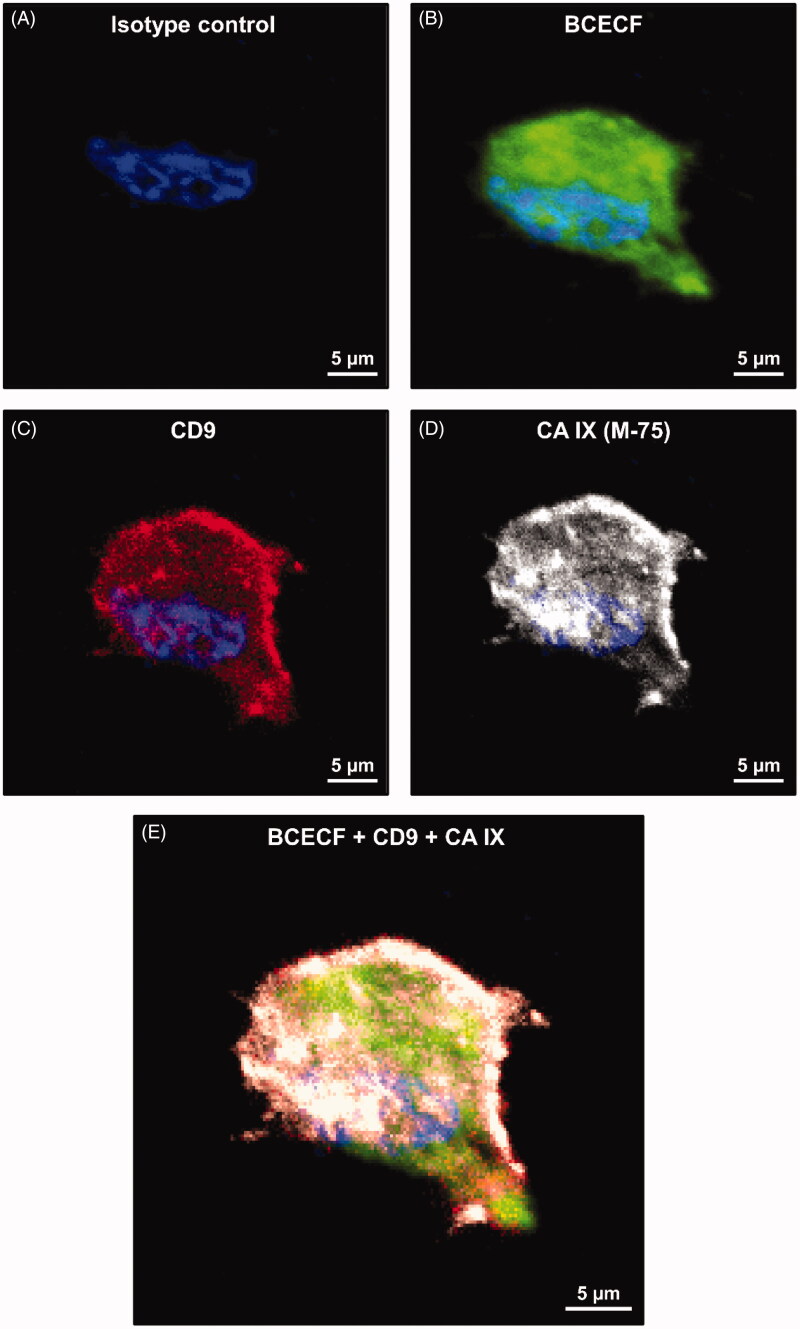
Figure 6.
Confocal microscopy analysis of BCECF and CA IX expression in LNCaP cell line cultured at pH 6.5. (A) Isotype control cell. (B) LNCaP cell labelled with BCECF (green signal). (C) LNCaP cell labelled with CD9 monoclonal antibody (M-L13, RUO, red signal). (D) LNCaP cell incubated with M75 and then with Alexa Fluor® 647 secondary antibody for CA IX detection (gray signal). (E) Merged image of different signals on LNCaP cells: BCECF (green signal), CD9 (red signal), CA IX (grey signal), nucleus (blue signal of DAPI).

