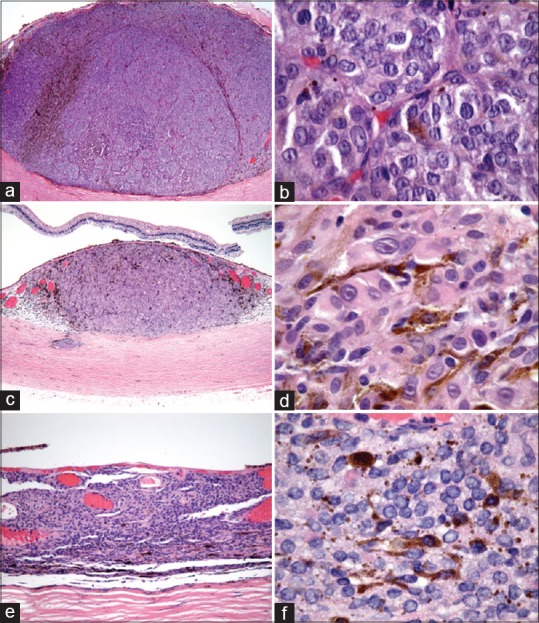
Figure 3.

Histopathology of each tumor. (a and b) The inferonasal melanoma demonstrated mixed cell type and 14 mitotic figures in 40 high-power fields (HPF). (c and d) The inferotemporal melanoma revealed mixed cell type and 1 mitotic figure in 40 HPF. (e and f) The superotemporal melanoma demonstrated mixed cell, predominantly spindle type and no mitotic figure in 40 HPF
