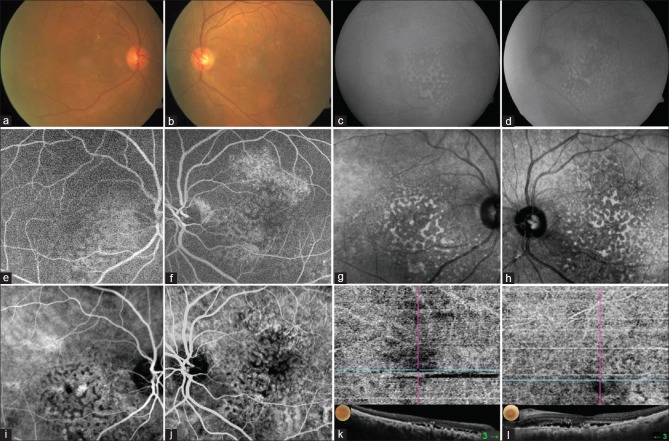
Figure 2.
Colour fundus photo shows multiple nummular pigmented RPE lesions at posterior pole (a and b). AF shows multiple hypoautofluorecent areas resembling giraffe-like pattern (c and d). FA shows multiple hypo as well as hyperfluorescent ares corresponding to RPE atrophy (e and f). IR imaging shows multiple hypo and hyperreflective lesion demonstrating entire extent of lesion (g and h). ICG shows multiple hyper and hypocyanscent spots corresponding to RPE lesions (i and j). OCTA in choriocapillary slab showed obscuration of choroidal vasculature with signal void areas (k and l)

