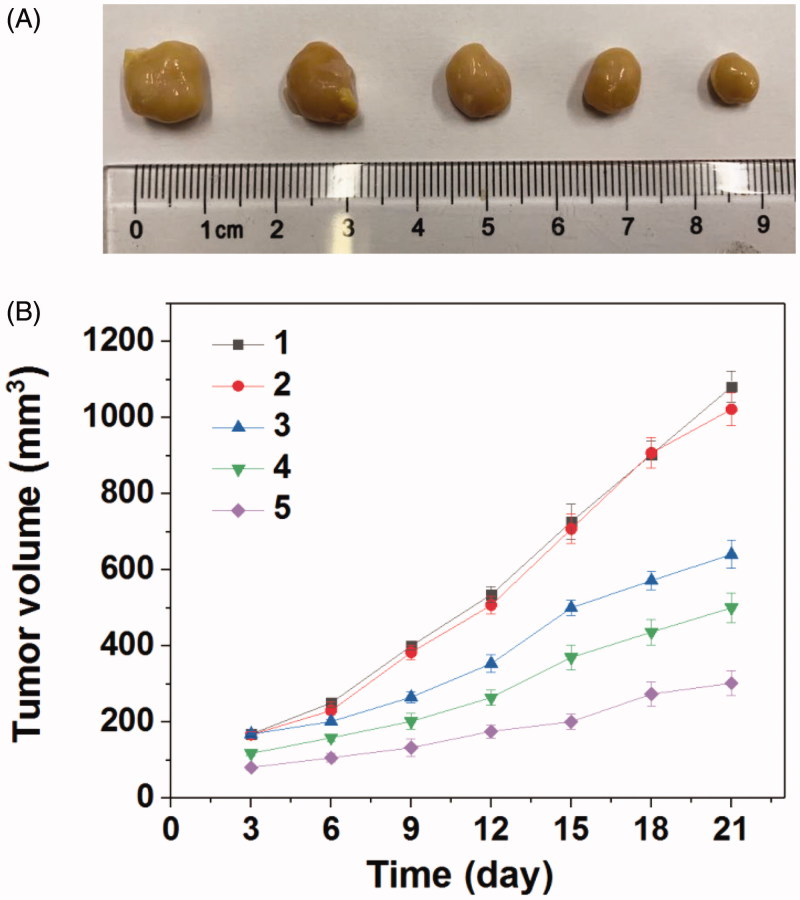
Figure 6.
(A) Representative image of HNE-1 tumors after the 21 days and (B) tumor growth profiles treated with different formulations (n = 5) (1: PBS; 2: Tf-PAAs (0.3 mg/g); 3: Tf-PAAs/pMMP-9 (pMMP-9 dose of 5 μg/g); 4: Tf-PAAs-MTX (MTX dose of 6.56 μg/g); 5: Tf-PAAs-MTX/pMMP-9 (pMMP-9 dose of 5 μg/g and MTX dose of 6.56 μg/g)).

