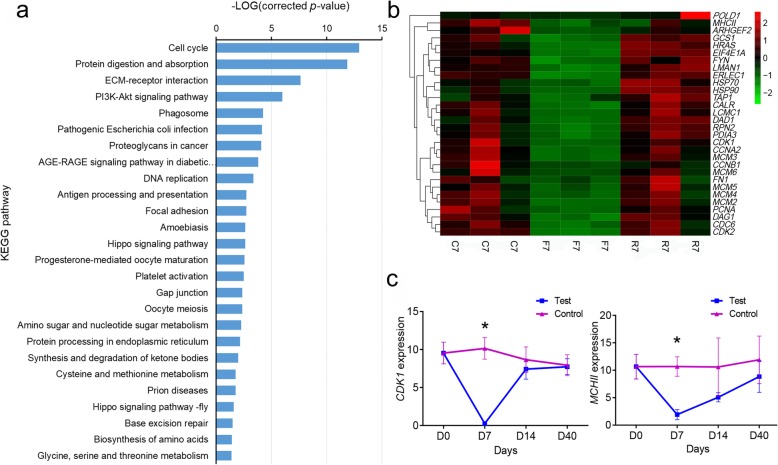
Fig. 5.
Analysis of down-regulated differentially expressed genes (DEGs) during fasting and refeeding. a classification of the down-regulated DEGs in the Kyoto Encyclopedia of Genes and Genomes (KEGG) database; b expression profiles of some down-regulated DEGs from the RNA-seq result; c the expression of CDK1 and MHCII in the control and test groups from the qRT-PCR result. Asterisks indicate significant differences between the control and test groups (* p < 0.05; Student’s t-test)

