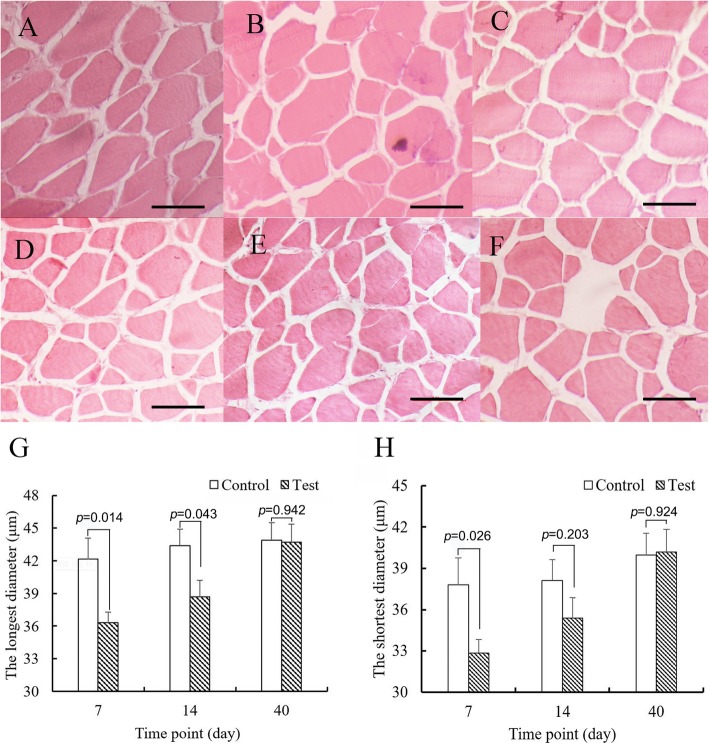
Fig. 8.
Changes in myofibers (a-f) indicate myofiber cross-sections in the control group at days 7, 14, 40 and the test group at day 7 (after 7 days fasting), 14 (after 7 days refeeding), 40 (after 33 days refeeding), respectively; g and h indicate the longest and shortest diameters of cross-section in the control and test groups, respectively. Asterisks indicate significant differences between the control and test groups (* p < 0.05; Student’s t-test; n = 5); bars = 50 μm

