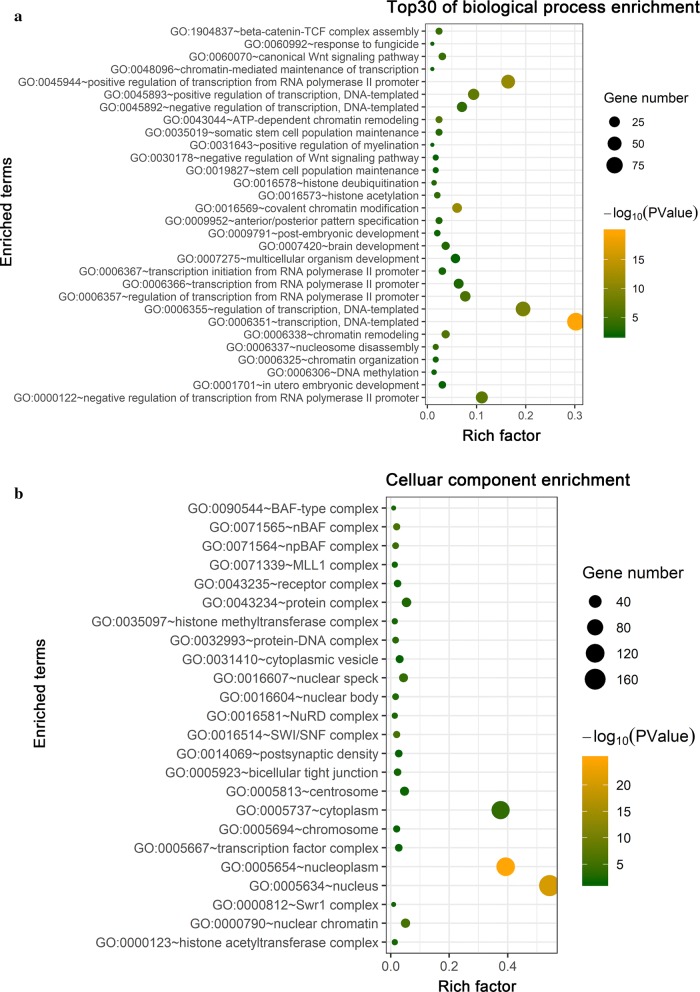
Fig. 6.
Using the Cbioportal and DAVID databases to analysis the pathway function of BCL9 and its associated molecular enrichment. a Biological processes that involve BCL9-related molecules. b Molecular function of BCL9-related molecules. The ordinate shows the name of the functional area. The abscissa shows the percentage of the corresponding part of the network as a whole. The bubble size indicates the number of genes that are located in the pathway or function. Colors indicate enriched P values. Deeper colors indicate more significant results

