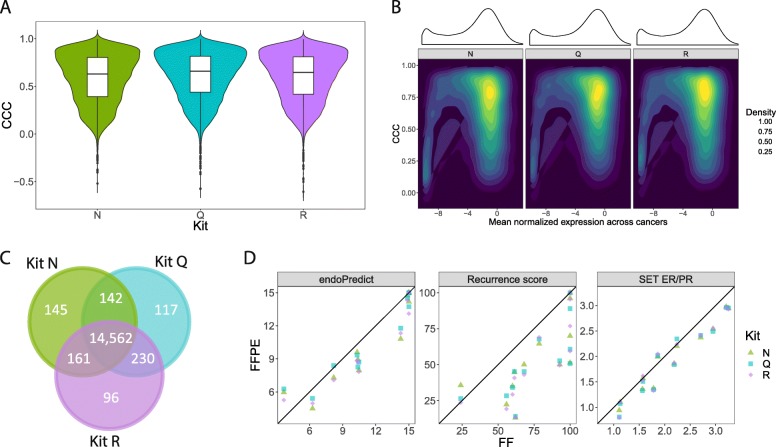
Fig. 3.
Concordance of gene expression between FFPE and FF samples for wtRNAseq data. a Distribution of concordance correlation coefficient (CCC) for all genes within each RNA extraction kit used. b Association between gene expression and CCC value. c High expression (normalized expression higher than − 7.5) and high concordant (CCC > 0.5) genes between different kits. d Concordance of molecular signatures scores for 3 FFPE kits in comparison to FF

