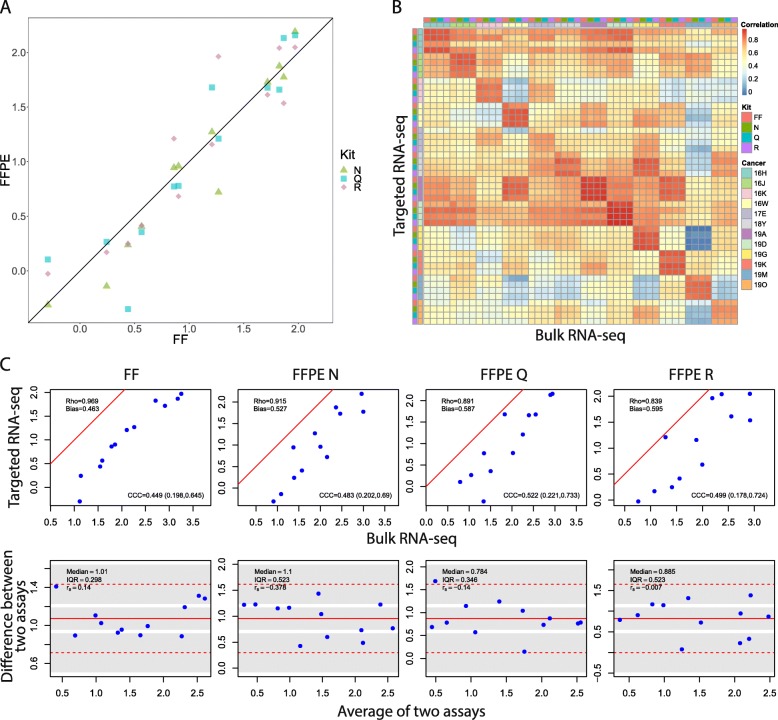
Fig. 5.
Robustness of targeted sequencing assay for SETER/PR index. a Concordance of SETER/PR between FFPE and FF samples. b Heatmap of correlation matrix between genes in SETER/PR index calculated on wtRNAseq and targeted RNAseq platforms. c Concordance of SETER/PR signature between two platforms (scatter plots on top and Bland-Altman plots on bottom)

