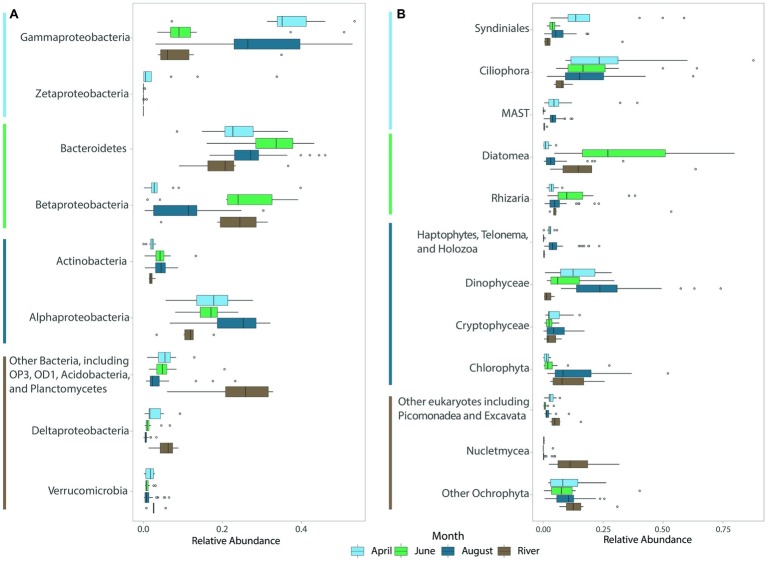
Figure 3.
Boxplots of abundant (A) bacterial and (B) eukaryotic (protistan and fungal) groups for each month across all years sampled. River samples, though collected in August, were averaged separately. The color of the lines next to taxa names indicates the month in which each taxon or group of taxa was most abundant.

