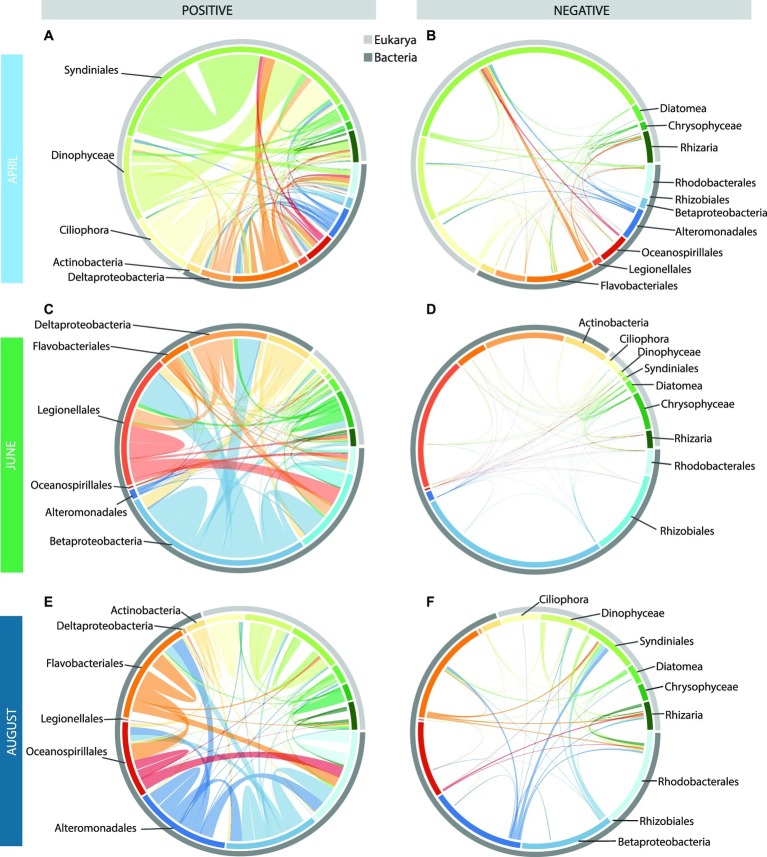
Figure 6.
Chord diagrams showing the positive and negative correlations among the top 15 taxa in the monthly co-occurrence networks [April: (A,B), June: (C,D), and August: (E,F)]. The inner circle shows the breakdown of how the correlations within each month are distributed among these 15 taxa, with the outer circle showing the domains to which these taxa belong. The width of the bar is proportional to the number of correlations (positive and negative) for each taxon with the other 14 taxa. The arcs drawn between bars (i.e., taxa) are proportional to the number of positive (left) or negative (right) correlations between these two taxa. Arcs that remain within a bar denote significant correlations among OTUs within that taxon.

